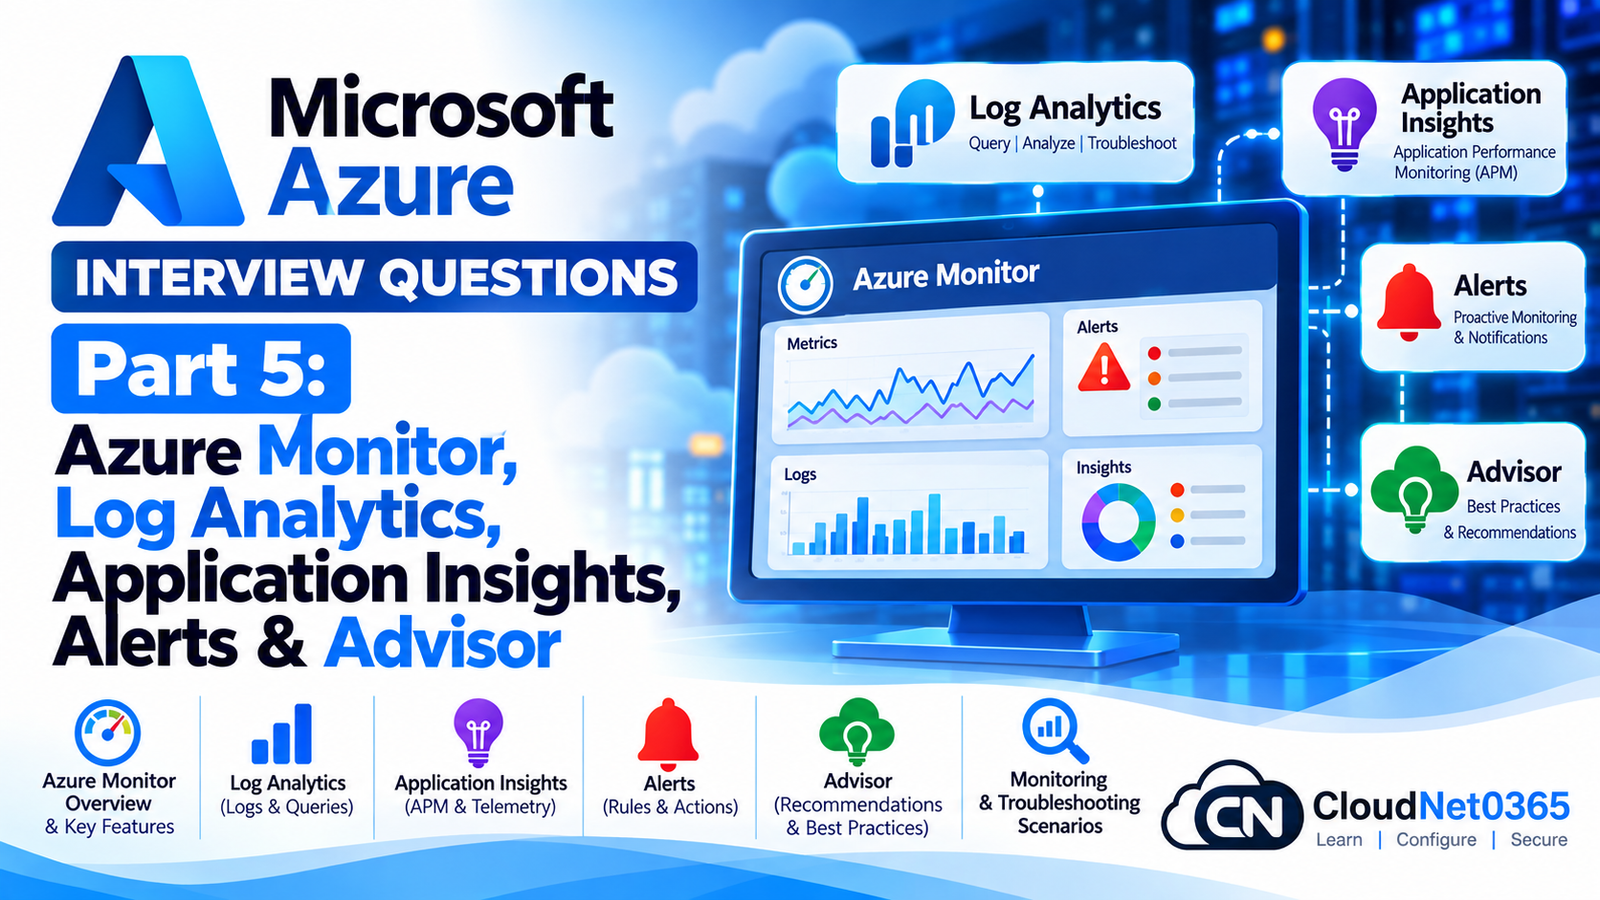
Monitoring is one of the most important responsibilities of a senior Azure administrator.
Deploying an Azure resource is only the beginning. In production, you need to know:
- Whether the resource is healthy
- Whether performance is degrading
- Why an application is failing
- Which configuration changed
- Where an incident started
- Whether users are affected
- When to alert administrators
- How to reduce alert noise
- How to investigate historical events
- How to identify reliability and cost improvements
Azure Monitor provides the central observability platform for Azure and hybrid environments. It brings together metrics, logs, traces and events for monitoring and troubleshooting.
This part focuses specifically on monitoring, observability, alerting and operational analysis.
Topics already covered in previous parts, such as VM sizing, VM disk troubleshooting, NSGs, Load Balancer health probes and Application Gateway backend health, are not repeated here except where they are needed to explain monitoring architecture.
Continue the Microsoft Azure Interview Series
← Previous Part: [Part 4: Load Balancer, Application Gateway, Front Door & Traffic Manager] | Complete Series: [Microsoft Azure Interview Questions & Answers – Complete Series]
Azure Monitor Interview Questions & Answers
1. What is Azure Monitor?
Azure Monitor is Microsoft’s unified observability service for Azure and hybrid environments.
It collects and analyzes telemetry such as:
- Metrics
- Logs
- Traces
- Events
It can then be used for:
- Monitoring
- Troubleshooting
- Alerting
- Visualization
- Automation
- Application performance analysis
Azure Monitor supports both Azure and hybrid resources.
2. What are the major types of telemetry in Azure Monitor?
The important telemetry categories are:
Metrics
Numeric time-series data.
Examples:
CPU percentage
Requests
Latency
Network bytes
Disk operations
Logs
Detailed records of events and activity.
Examples:
Windows events
Application logs
Azure Activity Log
Resource logs
Traces
Used particularly for understanding application request flows and dependencies.
Events
Records of significant occurrences such as resource or configuration changes.
A senior administrator should understand that metrics and logs answer different questions.
3. What is the difference between Azure Monitor Metrics and Logs?
Metrics
Best for:
- Fast numerical monitoring
- Dashboards
- Threshold alerts
- Time-series analysis
Example:
CPU = 92%
Logs
Best for:
- Detailed investigation
- Historical analysis
- Correlation
- Searching events
- KQL queries
Example:
Which application generated the errors?
Which user performed the operation?
What happened immediately before the failure?
A practical approach is:
Metric
  ↓
Detect problem

Logs
  ↓
Investigate problem
Azure Monitor stores logs and metrics in different data platforms.
4. What is a Log Analytics workspace?
A Log Analytics workspace is a centralized data store for Azure Monitor Logs.
It contains tables holding collected log and trace data.
It can receive data from:
- Azure resources
- Virtual machines
- Applications
- On-premises systems
- Other supported environments
The data can then be queried using Kusto Query Language (KQL).
5. What are the main types of monitoring data in Azure Monitor?
Important telemetry categories include:
Metrics
Numerical measurements collected over time.
Examples:
CPU percentage
Request count
Network throughput
Disk IOPS
Logs
Detailed records of events and activities.
Examples:
Authentication failures
Application exceptions
Azure control-plane operations
Operating system events
Traces
Detailed information about application execution and distributed requests.
Events
Records of activities or changes in state.
6. What is the Azure Activity Log?
Azure Activity Log records Azure control-plane operations.
Examples include:
- Resource creation
- Resource deletion
- Configuration changes
- Role assignment changes
- Resource restart operations
- Administrative operations
A common senior-level question is:
“Who changed this Azure resource?”
The Activity Log is one of the first places to investigate.
7. Is the Activity Log the same as resource logs?
No.
This distinction is important.
Activity Log
Primarily records Azure control-plane operations.
Resource logs
Contain service-specific telemetry generated by an Azure resource.
Therefore:
Activity Log
→ Azure management/control-plane activity

Resource Logs
→ Resource/service-specific telemetry
8. How long is Azure Activity Log data available?
Azure Activity Log data is retained for 90 days by default.
If longer retention or centralized analysis is required, Activity Log events can be exported to supported destinations such as:
- Log Analytics
- Storage Account
- Event Hubs
Retention requirements should be designed according to operational, security and compliance requirements.
9. What is Log Analytics?
Log Analytics is the Azure Monitor experience used to query and analyze log data stored in Log Analytics workspaces.
It uses:
Kusto Query Language (KQL)
Example:
AzureActivity
| where TimeGenerated > ago(24h)
| summarize count() by OperationNameValue
10. What is a Log Analytics workspace?
A Log Analytics workspace is a centralized data store for Azure Monitor logs and traces.
It can receive data from multiple resources.
For example:
VM1 ─────┐
VM2 ─────┤
VM3 ─────┤
App ─────┤
Azure ───┤
          ↓
Log Analytics Workspace
          ↓
        KQL
Organizations may use one or multiple workspaces depending on:
- Data residency
- Access boundaries
- Retention
- Cost
- Environment separation
- Operational ownership
11. What is the difference between a Log Analytics workspace and an Azure Monitor workspace?
They are different Azure resources.
Log Analytics workspace
Primarily used for:
- Logs
- Traces
- KQL-based analysis
Azure Monitor workspace
Used for Azure Monitor metrics scenarios, particularly managed Prometheus metrics.
The two should not be treated as interchangeable.
Log Analytics Workspace
→ Logs / traces
→ KQL

Azure Monitor Workspace
→ Prometheus metrics
→ PromQL
12. What is KQL?
KQL stands for:
Kusto Query Language
It is the query language used to analyze data in Azure Monitor Logs and other Microsoft services.
Example:
AzureActivity
| where TimeGenerated > ago(1h)
| project TimeGenerated, OperationNameValue, ActivityStatusValue, Caller
| order by TimeGenerated desc
KQL is especially important for:
- Troubleshooting
- Log analysis
- Custom alerts
- Dashboards
- Security investigation
- Operational reporting
13. What is the basic structure of a KQL query?
A typical query looks like:
TableName
| where Condition
| project Column1, Column2
| summarize count() by Column1
| order by Column1
Example:
AzureActivity
| where TimeGenerated > ago(24h)
| project TimeGenerated, Caller, OperationNameValue, ActivityStatusValue
| order by TimeGenerated desc
14. What does the where operator do?
where filters records.
Example:
AzureActivity
| where ActivityStatusValue == "Failed"
Another example:
AzureActivity
| where TimeGenerated > ago(1h)
15. What does the project operator do?
project selects the columns you want to display.
Example:
AzureActivity
| project TimeGenerated, Caller, OperationNameValue
This makes investigation output easier to read.
16. What does summarize do in KQL?
summarize performs aggregation.
Example:
AzureActivity
| summarize Count=count() by Caller
This can show how many operations were performed by each caller.
17. What does extend do in KQL?
extend creates a calculated column.
Example:
AzureActivity
| extend EventAge = now() - TimeGenerated
It is useful when creating calculated values for analysis.
18. What is the join operator in KQL?
join combines records from two datasets using a common field.
Potential correlation fields include:
- Resource ID
- Computer name
- Request ID
- Correlation ID
This is particularly useful during advanced investigations where information is distributed across multiple tables.
19. What is the difference between Azure Activity Log and Resource Logs?
This is an important distinction.
Activity Log
Records Azure Resource Manager-level operations.
Examples:
VM created
VM deleted
NSG rule changed
Role assignment changed
Storage Account configuration changed
It is primarily about management-plane activity.
Resource Logs
Provide logs generated by the resource/service itself.
Examples:
Application Gateway access logs
Key Vault logs
Storage logs
Firewall logs
Therefore:
Activity Log
→ What happened to the Azure resource?

Resource Logs
→ What happened inside/at the service?
20. How long is Azure Activity Log retained by default?
Azure Activity Log is retained by Azure for a limited period.
For longer retention or centralized analysis, you can export Activity Log data to destinations such as:
- Log Analytics workspace
- Storage Account
- Event Hub
Retention requirements should therefore be designed rather than relying solely on the default portal history.
21. What is a Diagnostic Setting?
A Diagnostic Setting defines where supported Azure resource logs and metrics should be sent.
Typical destinations include:
- Log Analytics workspace
- Storage Account
- Event Hub
- Supported partner solutions
Example:
Azure Resource
      |
Diagnostic Setting
      |
+-----+----------+
|     |          |
Logs  Metrics   Events
      |
Log Analytics
Diagnostic settings are an important part of centralized monitoring.
22. What is Azure Monitor Agent?
Azure Monitor Agent (AMA) is the supported Azure Monitor agent for collecting guest operating-system data from Azure and hybrid virtual machines.
It can collect data such as:
- Windows events
- Syslog
- Performance counters
- Text logs
- Other supported guest data
The agent uses Data Collection Rules to determine what data to collect and where to send it.
23. What replaced the legacy Log Analytics agent?
The Azure Monitor Agent is the supported agent for guest-OS data collection.
If an organization still has the older Log Analytics agent, it should plan migration according to Microsoft’s current migration guidance.
Do not design new monitoring architectures around the legacy agent.
24. What is a Data Collection Rule (DCR)?
A Data Collection Rule defines:
- What data to collect
- How data is processed
- Where data is sent
For example:
VM
 |
Azure Monitor Agent
 |
DCR
 |
+----------------+
|                |
Windows Events   Performance Counters
 |
Log Analytics Workspace
DCRs provide centralized and consistent monitoring configuration.
25. Why are DCRs important in an enterprise environment?
Imagine an organization has:
1,500 Windows servers
500 Linux servers
Manually configuring every server individually would be difficult to maintain.
With DCRs, you can define standardized collection policies and associate them with appropriate resources.
This provides:
- Consistency
- Centralized management
- Easier changes
- Better control over data collection
- Reduced unnecessary ingestion
26. What is a DCR association?
A DCR association connects a resource, such as a VM, to a Data Collection Rule.
Conceptually:
VM
 |
DCR Association
 |
DCR
 |
Data Collection
 |
Destination
A VM can have multiple DCR associations when the monitoring design requires different collection rules.
27. What is data transformation in Azure Monitor?
Data transformation allows collected data to be filtered or modified before it is stored/used.
For example, you may collect a large amount of data but only need certain events.
Conceptually:
Raw Data
   ↓
DCR Transformation
   ↓
Filtered Data
   ↓
Log Analytics
This can help reduce:
- Unnecessary ingestion
- Storage
- Query volume
- Operational noise
DCRs support data filtering and transformation capabilities.
28. What is VM Insights?
VM Insights is an Azure Monitor capability that simplifies monitoring Azure and hybrid virtual machines.
It helps collect and visualize:
- Performance data
- Guest OS information
- Dependency information where supported/configured
- VM health-related telemetry
VM Insights can simplify onboarding of Azure Monitor Agent and commonly used performance collection.
29. Does enabling VM Insights mean every possible VM log is collected?
No.
VM Insights provides a simplified monitoring experience and commonly used collection configuration, but monitoring should still be designed around the workload.
You should decide:
- Which events are needed
- Which performance counters matter
- Which logs are valuable
- Where data should be stored
- How long data should be retained
Collecting everything without a purpose can increase cost and noise.
30. How would you monitor 1,000 Azure VMs without creating 1,000 separate configurations?
Use scalable monitoring architecture.
A typical approach is:
Azure Policy / Automation
        ↓
Azure Monitor Agent
        ↓
DCR
        ↓
Log Analytics
        ↓
Centralized Alerts
Use resource-based or scope-based alerting where appropriate rather than creating a separate rule for every VM.
Microsoft specifically documents strategies for scaling alert rules across multiple VMs.
31. What is an Azure Monitor alert?
An Azure Monitor alert evaluates monitoring data against defined conditions.
When the condition is met, the alert can trigger an action.
Example:
CPU > threshold
      ↓
Alert Rule
      ↓
Action Group
      ↓
Email / Teams / Automation
Alerts can be based on metrics, logs and other supported signals.
32. What are the main types of Azure Monitor alerts?
Important alert categories include:
- Metric alerts
- Log search alerts
- Activity Log alerts
- Service Health alerts
- Resource Health alerts
- Smart detection/anomaly-related application alerts where applicable
The correct alert type depends on what you are monitoring.
33. What is a metric alert?
A metric alert evaluates a numeric metric.
Example:
CPU > 80%
or:
Available memory < thresholdMetric alerts are generally useful when the required signal is already available as a metric.
34. What is a log search alert?
A log search alert executes a KQL query and evaluates its result.
Example:
AzureActivity
| where ActivityStatusValue == "Failed"
| summarize FailureCount = count()
The alert can trigger when the query result meets the configured condition.
This is useful when the required signal exists in logs rather than as a simple metric.
35. When should you use a metric alert instead of a log alert?
Use a metric alert when:
- The required metric already exists.
- You need fast threshold monitoring.
- You don’t need complex log analysis.
Use a log alert when:
- The condition depends on log content.
- You need KQL.
- Multiple events must be correlated.
- The required signal is not available as a metric.
Example:
CPU > 90%
→ Metric alert

Five authentication failures from the same IP
→ Log alert
36. What is a dynamic threshold alert?
Dynamic thresholds use historical behavior and machine-learning techniques to determine expected metric or query behavior.
Instead of manually specifying:
CPU > 80%
the system can learn normal patterns such as:
Monday 9 AM → High
Monday 2 AM → Low
Weekend → Low
and identify deviations.
Dynamic thresholds are useful when normal values vary over time.
37. When can static thresholds be better than dynamic thresholds?
Static thresholds are often better when the limit is based on a hard operational requirement.
Example:
Disk free space < 10%
or:
Certificate expiration < 14 days
If the business requirement is fixed, a static threshold can be easier to understand and operate.
38. What is an Action Group?
An Action Group defines what should happen when an Azure Monitor alert fires.
Actions can include:
- SMS
- Push notification
- Voice
- Webhook
- Azure Function
- Logic App
- Other supported automation mechanisms
Action Groups are reusable and can be associated with multiple alerts.
39. Why should Action Groups be separated from alert rules?
Suppose an organization has:
100 alert rules
and all need to notify the same operations team.
Instead of configuring recipients separately in every rule:
100 Alerts
     ↓
One reusable Action Group
     ↓
Operations Team
This simplifies administration.
It also allows notification destinations to be changed centrally.
40. Can one alert use multiple Action Groups?
Yes.
Azure Monitor allows multiple action groups to be associated with an alert rule.
The actions are executed concurrently rather than in a guaranteed sequence.
41. What is alert fatigue?
Alert fatigue occurs when administrators receive too many alerts.
Example:
10,000 alerts/month
       ↓
Most are low-value
       ↓
Administrators ignore alerts
       ↓
Critical alert gets missed
A good monitoring design prioritizes:
- Actionable alerts
- Appropriate thresholds
- Deduplication
- Suppression where appropriate
- Meaningful severity
- Correct recipients
42. How would you reduce alert noise?
Use:
- Meaningful thresholds.
- Dynamic thresholds where appropriate.
- Aggregation.
- Scope-based alerts.
- Alert processing rules where appropriate.
- Maintenance suppression.
- Correct severity.
- Appropriate evaluation frequency.
- KQL filtering.
- Different notification paths for different severities.
The objective is:
Fewer alerts
+
Higher signal
=
Better operations
43. What is an alert processing rule?
Alert processing rules allow you to modify how alerts are processed after they are generated.
Depending on the supported scenario, they can be used to:
- Add/remove action groups
- Suppress notifications
- Apply rules during maintenance windows
This can be useful when the alert itself remains valid but notification behavior needs temporary modification.
44. What is the difference between disabling an alert and suppressing its notifications?
Disable alert
Stops the alert rule from evaluating/generating alerts.
Suppress notification
The alert can still be generated, but notification behavior is changed.
This distinction is useful during planned maintenance.
For example:
Maintenance Window
        ↓
Keep alert rule active
        ↓
Suppress notifications
This preserves monitoring while avoiding unnecessary notifications.
45. What is Azure Service Health?
Azure Service Health provides information about Azure service incidents, planned maintenance and health advisories that can affect your resources or services.
It includes experiences such as:
- Service issues
- Planned maintenance
- Health advisories
It is particularly useful during Azure platform incidents.
46. What is Azure Resource Health?
Resource Health provides information about the health of an individual Azure resource.
Example:
Azure VM
   ↓
Resource Health
   ↓
Healthy / Degraded / Unavailable
This is different from Service Health.
47. What is the difference between Service Health and Resource Health?
Service Health
Answers:
Is an Azure service/platform issue affecting me or my environment?
Resource Health
Answers:
What is the health state of this specific resource?
Example:
Service Health
→ Azure Storage regional incident

Resource Health
→ This particular VM is unavailable
Both should be checked during major incidents.
48. What is the Azure Activity Log useful for during an incident?
Suppose a production application suddenly stops working.
You discover:
NSG rule changed 10 minutes ago
Activity Log can help identify the management-plane operation.
You can investigate:
- Who performed it
- What operation occurred
- Which resource was affected
- When it happened
- Whether the operation succeeded or failed
This makes Activity Log extremely useful for change-related troubleshooting.
49. How would you investigate an unexplained configuration change?
Use:
Activity Log
     ↓
Time of change
     ↓
Operation
     ↓
Caller
     ↓
Resource
     ↓
Related deployment/change
Then correlate with:
- Azure Resource Graph
- Change history where available
- Deployment records
- Source-control/IaC changes
- Administrative records
50. What is Azure Monitor Workbook?
A Workbook is an interactive reporting and visualization tool in Azure Monitor.
It can combine:
- Text
- Metrics
- KQL queries
- Charts
- Parameters
- Tables
Example:
Operations Workbook
│
├── VM health
├── CPU
├── Memory
├── Storage
├── Application errors
└── Network metrics
This is useful for creating operational dashboards.
51. What is the difference between a Dashboard and a Workbook?
Azure Dashboard
Primarily a customizable portal dashboard for displaying resource information and visualizations.
Workbook
Designed for interactive monitoring and reporting using:
- Queries
- Metrics
- Parameters
- Visualizations
- Text
Workbooks are particularly useful for building operational investigation views.
52. What is Application Insights?
Application Insights is an application performance monitoring capability within Azure Monitor.
It helps monitor applications by collecting telemetry such as:
- Requests
- Dependencies
- Exceptions
- Traces
- Performance information
- Availability
Current Azure Monitor documentation describes Application Insights as an OpenTelemetry-based application monitoring capability.
53. What is the difference between Azure Monitor and Application Insights?
Think of it as:
Azure Monitor
      |
      +--- Infrastructure monitoring
      |
      +--- Metrics
      |
      +--- Logs
      |
      +--- Alerts
      |
      +--- Application Insights
                |
                +--- Application telemetry
Application Insights focuses on application performance and behavior, while Azure Monitor provides the broader observability platform.
54. What is distributed tracing?
Distributed tracing follows a request as it moves across multiple application components.
Example:
User
 ↓
Web App
 ↓
API
 ↓
Service
 ↓
Database
If the total request takes 4 seconds, distributed tracing can help determine which dependency consumed most of the time.
This is especially valuable for microservices.
55. What is an Application Insights dependency?
A dependency is an external component that an application calls.
Examples:
- Database
- HTTP API
- Storage
- Queue
- Other services
Example:
Web Application
      ↓
SQL Database
      ↓
Dependency
Dependency telemetry helps identify slow or failing downstream components.
56. An application is slow. CPU is normal. What would you investigate?
Do not assume the application itself is healthy simply because CPU is low.
Use Application Insights to investigate:
- Request duration
- Dependency duration
- Failed requests
- Exceptions
- External API latency
- Database latency
- Trace information
Example:
Request = 4 seconds

Application processing = 200 ms
Database = 3.5 seconds
The application server CPU can be normal while the application remains slow.
57. How can Application Insights help identify a database bottleneck?
Analyze dependency telemetry.
Example:
HTTP Request
   |
   +--- Application processing: 100 ms
   |
   +--- SQL dependency: 2.8 sec
This points the investigation toward the database rather than immediately scaling the application server.
58. What is an Application Insights availability test?
Availability testing checks whether an application endpoint is reachable and responding as expected.
It can help detect:
- Application outage
- Endpoint failure
- Excessive response time
- Regional availability problems
Availability tests can generate alerts when the endpoint becomes unavailable.
59. Why are availability tests useful if you already have server monitoring?
Server monitoring answers:
Is my server healthy?
Availability testing answers:
Can a user actually reach the application and receive an expected response?
These are different.
Example:
VM CPU → 20%
VM Memory → 40%
VM → Healthy

Website → HTTP 500
Infrastructure monitoring alone may not detect the application-level outage.
60. What is synthetic monitoring?
Synthetic monitoring uses automated requests to simulate user interactions or endpoint access.
For example:
Every 5 minutes:

Open website
     ↓
Check response
     ↓
Check response time
     ↓
Alert if failure
This provides an external perspective of application availability.
61. How would you troubleshoot an application that users report as slow?
Use a top-down approach:
User
 ↓
Application availability
 ↓
Request duration
 ↓
Application processing
 ↓
Dependencies
 ↓
Database/API/Storage
 ↓
Infrastructure
Use:
- Application Insights
- Azure Monitor Metrics
- Log Analytics
- Application logs
Avoid starting with VM resizing unless telemetry indicates a compute bottleneck.
62. What is a correlation ID and why is it useful?
A correlation ID is an identifier used to associate related operations across components.
Example:
Request ID:
abc-123
The same identifier can be included in:
Web application
 ↓
API
 ↓
Database/logging
During troubleshooting, it helps correlate events belonging to the same user request.
63. How would you investigate an HTTP 500 application error?
Start with Application Insights.
Check:
- Failed requests.
- Exceptions.
- Request details.
- Dependencies.
- Traces.
- Deployment/change history.
- Application logs.
Then correlate the failure timestamp with infrastructure telemetry.
64. What is Azure Monitor Logs cost optimization?
Log ingestion and retention can generate significant costs in large environments.
Optimization strategies include:
- Collect only required data.
- Filter unnecessary events.
- Use DCR transformations.
- Select appropriate table plans.
- Review retention.
- Avoid duplicate collection.
- Monitor workspace usage.
DCR-based filtering and transformations can help control unnecessary ingestion.
65. Why is collecting every Windows Event Log channel not always a good idea?
Because large environments can generate huge volumes of data.
For example:
5,000 servers
×
Large event volume
=
Very high ingestion
This can increase:
- Cost
- Query complexity
- Noise
- Storage requirements
Instead, identify which events are actually required for:
- Operations
- Security
- Compliance
- Troubleshooting
66. How would you design Log Analytics workspaces for a large organization?
There is no universal rule such as:
“Always use one workspace.”
Evaluate:
- Geographic requirements
- Data residency
- Security boundaries
- Operational teams
- Retention
- Cost
- Query requirements
- Microsoft Sentinel architecture
- Cross-resource monitoring
Some organizations use centralized workspaces, while others use multiple workspaces for isolation and governance.
67. What is the difference between Log Analytics workspace and Azure Monitor workspace?
This is a current and important Azure terminology question.
Log Analytics workspace
Used for Azure Monitor Logs:
- Logs
- Traces
- KQL
Azure Monitor workspace
Currently used for Prometheus metrics collected by Azure Monitor.
It is a different resource type with a different data platform.
Do not treat the two as interchangeable merely because both names contain “workspace.”
68. What is Prometheus?
Prometheus is a monitoring and metrics system commonly used for infrastructure and cloud-native workloads.
It stores numeric time-series metrics.
Example:
http_requests_total
cpu_usage
memory_usage
Azure Monitor supports managed Prometheus scenarios.
Prometheus metrics are currently stored in Azure Monitor workspaces and queried using PromQL.
69. What is PromQL?
PromQL stands for:
Prometheus Query Language
It is used to query Prometheus metrics.
This differs from KQL:
KQL
→ Azure Monitor Logs

PromQL
→ Prometheus metrics
This distinction is increasingly important in modern Azure monitoring environments.
70. What is Azure Advisor?
Azure Advisor is a recommendation service that analyzes Azure resource configuration and usage telemetry and provides recommendations across:
- Reliability
- Security
- Performance
- Cost
- Operational Excellence
It is intended to help optimize Azure deployments rather than act as a real-time monitoring system.
71. Is Azure Advisor the same as Azure Monitor?
No.
Azure Monitor
Answers:
What is happening now and what happened?
Azure Advisor
Answers:
What improvements does Azure recommend for my environment?
Example:
Azure Monitor
→ CPU has been high

Azure Advisor
→ Consider changing configuration/SKU based on observed usage
They complement each other.
72. What are the five Azure Advisor categories?
Current Advisor categories are:
- Reliability
- Security
- Performance
- Cost
- Operational Excellence
These categories cover different optimization areas.
73. Should you blindly implement every Azure Advisor recommendation?
No.
Advisor recommendations are recommendations, not automatic architectural decisions.
For each recommendation, evaluate:
- Business requirements
- Application architecture
- Risk
- Cost
- Availability requirements
- Security requirements
- Maintenance impact
A recommendation that is appropriate for one workload may not be appropriate for another.
74. What is Azure Advisor useful for during a cost optimization exercise?
Advisor can identify opportunities such as:
- Idle resources
- Underutilized resources
- Appropriate sizing opportunities
- Storage-related cost improvements
- Other cost optimization opportunities
Cost recommendations are available through the Cost category.
75. What is the difference between Azure Advisor and Azure Cost Management?
Azure Advisor
Provides recommendations.
Azure Cost Management
Provides detailed cost analysis, budgets, cost allocation and financial management capabilities.
Example:
Advisor
→ "This resource may be underutilized."

Cost Management
→ "This subscription spent ₹X / $X and this resource group consumed Y%."
They solve different operational problems.
76. How would you investigate unexpected Azure cost growth?
Use a combination of:
Cost Management
+
Azure Advisor
+
Azure Monitor
+
Resource inventory
Check:
- Which service increased?
- Which resource increased?
- Was there a deployment?
- Did data transfer increase?
- Did log ingestion increase?
- Did VM capacity increase?
- Did storage grow?
- Did a resource stop being deallocated?
Do not assume that the most expensive resource is automatically the cause of the increase.
77. How can excessive Azure Monitor logging increase cost?
Consider:
More data collected
      ↓
More ingestion
      ↓
More storage
      ↓
More query/retention requirements
      ↓
Higher cost
Therefore, monitoring itself must be designed economically.
78. How would you monitor a production Azure application end-to-end?
A good architecture could be:
Users
  |
Application
  |
Application Insights
  |
+-------------------------+
|                         |
Requests             Dependencies
|                         |
Exceptions             Database
|                         |
Traces                  APIs
|
Azure Monitor
|
+----------------------------+
|                            |
Metrics                   Logs
|                            |
Alerts                   Log Analytics
|                            |
Action Groups             KQL
Then use Azure Advisor for periodic optimization recommendations.
79. How would you design monitoring for an on-premises + Azure hybrid environment?
Use a common observability architecture.
Example:
Azure VMs
     \
      \
On-Prem Servers → Azure Monitor
      /
Azure Resources
Use:
- Azure Monitor Agent
- DCRs
- Log Analytics
- Azure Arc where appropriate
- Centralized alerts
- Application Insights
Azure Monitor supports hybrid monitoring scenarios.
80. A monitoring agent is installed but no VM logs appear. What would you check?
Use this sequence:
VM
 ↓
Azure Monitor Agent
 ↓
DCR Association
 ↓
DCR Data Source
 ↓
DCR Destination
 ↓
Network
 ↓
Log Analytics
Check:
- Agent installation.
- Agent health.
- DCR association.
- Data source configuration.
- Destination.
- Workspace permissions/configuration.
- Network connectivity.
- Whether the expected data is actually being generated.
Do not reinstall the agent immediately.
81. A DCR exists but no data arrives. What would you check?
Check:
DCR
 |
+-- Data source
 |
+-- Destination
 |
+-- Transformation
 |
+-- Association
Specifically verify:
- Correct VM/resource association.
- Correct event/performance source.
- Correct destination workspace.
- No transformation filtering the required records.
- Agent is running.
- Expected events are being generated.
82. Logs appear in Log Analytics but an alert does not fire. What would you investigate?
Check:
- KQL query.
- Time range.
- Alert evaluation frequency.
- Alert condition.
- Threshold.
- Query result.
- Alert rule scope.
- Action Group.
- Alert processing rules.
- Notification channel.
A useful approach is:
KQL query works manually?
        |
       YES
        ↓
Alert condition correct?
        ↓
Action Group correct?
        ↓
Notification path working?
83. An alert fires repeatedly every few minutes. How would you reduce the noise?
Check:
- Evaluation frequency
- Threshold
- Aggregation
- Dynamic threshold
- Alert dimensions
- Suppression/processing rules
- Whether the alert condition clears properly
- Whether one alert rule is creating many independent alert instances
The goal is to alert on actionable conditions rather than every individual telemetry fluctuation.
84. CPU frequently crosses 80% for only one minute. Should you alert?
Not necessarily.
Ask:
- Is the spike expected?
- Is it correlated with application impact?
- Is CPU sustained?
- Is the application actually degraded?
A better alert might be:
CPU > 80%
for 10 minutes
rather than:
CPU > 80%
for 1 minute
The correct threshold and duration depend on the workload.
85. How would you monitor a critical website from the user’s perspective?
Use:
- Application Insights availability tests
- Application Insights request telemetry
- Dependency telemetry
- Azure Monitor alerts
Monitor:
Availability
Response time
HTTP failures
Dependencies
Exceptions
This detects problems that infrastructure-only monitoring may miss.
86. How would you investigate a website that is available but slow?
Compare:
Availability
      ↓
Request duration
      ↓
Dependency duration
      ↓
Exceptions
      ↓
Infrastructure metrics
For example:
Availability = 100%

Request latency = 5 sec

Database dependency = 4.2 sec
The issue is likely in a dependency rather than basic website availability.
87. How would you investigate an outage that began immediately after a deployment?
Correlate:
Deployment time
      ↓
Application errors
      ↓
Application Insights
      ↓
Activity Log
      ↓
Configuration changes
      ↓
Dependency failures
Determine whether:
- Code changed
- Configuration changed
- Identity permissions changed
- Network configuration changed
- Secret/certificate changed
- Dependency version changed
This is much more reliable than simply restarting the application.
88. How would you investigate a production incident where users report intermittent failures?
Start by determining:
All users?
Some users?
One region?
One backend?
One API?
One dependency?
Then correlate:
- Request IDs
- Application Insights
- Backend health
- Logs
- Metrics
- Deployment history
- Activity Log
Intermittent problems often require correlation across multiple telemetry sources.
89. What is the role of Azure Monitor in incident response?
Azure Monitor provides:
Detection
   ↓
Investigation
   ↓
Alerting
   ↓
Automation
   ↓
Evidence for root cause analysis
It should be part of an operational process rather than simply a dashboard.
90. How can Azure Monitor trigger automated remediation?
An alert can invoke an Action Group that triggers supported automation such as:
- Azure Function
- Logic App
- Webhook
- Other supported actions
Example:
Service failure
     ↓
Azure Monitor Alert
     ↓
Action Group
     ↓
Logic App
     ↓
Remediation workflow
Action Groups support automated actions in addition to human notifications.
91. Give an example of safe automated remediation.
Example:
Application service stopped
        ↓
Alert
        ↓
Action Group
        ↓
Automation
        ↓
Restart service
However, automation should include:
- Scope controls
- Failure handling
- Logging
- Idempotency
- Approval where appropriate
Blind automation can make incidents worse.
92. What would you include in an enterprise Azure monitoring strategy?
I would divide it into several layers:
Platform
- Service Health
- Resource Health
- Activity Log
Infrastructure
- VM metrics
- Guest OS telemetry
- Storage
- Network
Application
- Requests
- Dependencies
- Exceptions
- Traces
- Availability
Security
- Relevant security logs
- Microsoft Defender for Cloud
- Microsoft Sentinel where applicable
Alerting
- Action Groups
- Severity
- Escalation
- Suppression
Operations
- Workbooks
- Dashboards
- KQL
- Runbooks/automation
Optimization
- Azure Advisor
- Cost Management
93. What is your complete approach to designing production monitoring?
A strong senior-level answer is:
First, identify the business-critical services
and their SLO/SLA requirements.

Then define what must be measured:

Availability
Latency
Errors
Capacity
Dependencies
Security events
Configuration changes
94. Why would you filter logs before ingestion?
Suppose thousands of resources generate verbose logs that nobody uses.
Ingesting everything can increase:
- Data volume
- Storage
- Query workload
- Monitoring cost
Filtering genuinely unnecessary telemetry can therefore improve both operational efficiency and cost control.
However, filtering should be based on documented requirements rather than simply deleting data because it appears unimportant.
95. What are Diagnostic Settings?
Diagnostic settings configure supported Azure resources to send platform logs and metrics to destinations such as:
- Log Analytics workspace
- Storage Account
- Event Hubs
- Supported partner solutions
Conceptually:
Azure Resource
      ↓
Diagnostic Setting
      ↓
Destination
Diagnostic settings are therefore an important part of building centralized monitoring.
96. Are resource logs automatically available for every Azure resource?
No.
A common mistake is assuming that because Azure Monitor exists, every detailed resource log is automatically stored.
For many Azure services, you must configure Diagnostic Settings to send resource logs to a destination.
Therefore, if an administrator cannot find historical resource logs, check:
- Whether the resource supports the required log category
- Whether Diagnostic Settings were configured
- Whether the correct destination was selected
- Whether the expected time range is covered
- Whether the relevant logs were actually generated
97. How would you troubleshoot a resource where expected logs are missing?
Use a structured approach:
Step 1
Identify the resource.
Step 2
Check Diagnostic Settings.
Step 3
Verify enabled categories.
Step 4
Verify destination.
Step 5
Check the destination workspace.
Step 6
Confirm the expected table exists.
Step 7
Run a time-bounded KQL query.
Step 8
Check whether the resource actually generated the event.
Do not immediately assume that Log Analytics itself is broken.
98. What is Application Insights?
Application Insights is an Azure Monitor application performance monitoring capability.
It helps monitor application behavior such as:
- Requests
- Dependencies
- Exceptions
- Traces
- Availability
- Performance
- Distributed transactions
It is designed to answer questions such as:
“The application is slow. Which dependency or operation is causing the delay?”
99. What is workspace-based Application Insights?
Workspace-based Application Insights stores application telemetry in a Log Analytics workspace.
This allows application telemetry to be queried using KQL alongside other Azure Monitor logs.
For example:
Application
    ↓
Application Insights
    ↓
Log Analytics Workspace
    ↓
KQL
This is particularly useful for centralized observability.
100. What types of application telemetry can Application Insights collect?
Common telemetry includes:
- Requests
- Dependencies
- Exceptions
- Traces
- Page views
- Custom events
- Application metrics
For workspace-based Application Insights, commonly used tables include:
AppRequests
AppDependencies
AppExceptions
AppTraces
AppPageViews
The exact telemetry available depends on the application and instrumentation.
101. What is distributed tracing?
Distributed tracing follows a request as it travels through multiple application components.
For example:
User
 ↓
Web Application
 ↓
API
 ↓
Database
 ↓
External Service
A distributed trace can help identify which component contributed to latency or failure.
This is particularly valuable in microservice environments.
102. What is Application Map in Application Insights?
Application Map provides a visual representation of application components and their dependencies.
For example:
Web App
   |
   +---- API
   |
   +---- SQL Database
   |
   +---- External API
It can help identify:
- Failed components
- Slow dependencies
- Request relationships
- Application architecture
It is useful as an investigation starting point, but detailed analysis should still use telemetry and logs.
103. What are Application Insights availability tests?
Availability tests allow you to test whether an application endpoint is reachable and responding as expected from supported test locations.
They help answer:
“Can users reach the application?”
They can detect availability problems independently of normal user traffic.
104. How would you investigate a sudden increase in application exceptions?
Start with the time range when exceptions increased.
Then investigate:
Exception count
      ↓
Exception type
      ↓
Affected operation
      ↓
Affected dependency
      ↓
Deployment/configuration change
Example KQL:
AppExceptions
| where TimeGenerated > ago(2h)
| summarize Count=count() by ExceptionType
| order by Count desc
Then investigate the most significant exception types in context.
105. How would you identify slow application requests using KQL?
For example:
AppRequests
| where TimeGenerated > ago(1h)
| where DurationMs > 2000
| project TimeGenerated, Name, DurationMs, ResultCode
| order by DurationMs desc
This identifies requests taking more than two seconds.
The threshold should be adjusted according to the application’s actual SLA/SLO.
106. How would you identify failed application requests?
Example:
AppRequests
| where TimeGenerated > ago(1h)
| where Success == false
| summarize Failures=count() by Name
| order by Failures desc
This helps identify which operations are producing the most failures.
107. How would you investigate dependencies causing application failures?
Example:
AppDependencies
| where TimeGenerated > ago(1h)
| where Success == false
| summarize Failures=count() by Target, DependencyType
| order by Failures desc
You can then correlate the dependency failures with:
- Application exceptions
- Request failures
- Deployment changes
- Infrastructure events
108. What is an Azure Monitor metric alert?
A metric alert triggers when a metric meets a configured condition.
Example:
Metric:
CPU Percentage

Condition:
Greater than 90%

Evaluation:
5 minutes

Action:
Send notification
Metric alerts are useful when you need fast notification based on numerical telemetry.
109. What is a log search alert?
A log search alert evaluates a KQL query and triggers when the query result meets the configured condition.
Example:
AzureActivity
| where ActivityStatusValue == "Failed"
You could configure an alert based on the number of matching events.
Log-based alerts are useful when the condition cannot be represented adequately by a simple metric.
110. What is an Activity Log alert?
An Activity Log alert triggers when a specified Azure Activity Log event occurs.
For example:
Administrative operation
+
Specific resource
+
Specific operation
A security team could use an Activity Log alert for sensitive administrative changes.
111. What is the difference between metric alerts and log alerts?
Metric alert
Works against numerical metric data.
Example:
CPU > 90%
Log alert
Evaluates records using KQL.
Example:
Count of failed administrative operations > 5
A simple way to remember:
Metric alert → numerical condition

Log alert → query-based condition
112. What are dynamic thresholds in Azure Monitor alerts?
Dynamic thresholds allow Azure Monitor to establish expected behavior based on historical patterns rather than requiring a manually fixed threshold in every situation.
For example, instead of:
CPU > 80%
the monitoring system can learn expected patterns and identify unusual deviations.
Dynamic thresholds can be useful when:
- Workload changes throughout the day
- Traffic is seasonal
- Different resources have different normal behavior
- Static thresholds produce excessive alerts
They should still be validated against the actual business workload.
113. What is an Action Group?
An Action Group defines what happens when an alert is triggered.
Possible actions can include:
- SMS
- Push notifications
- Voice notifications
- Webhooks
- Azure Functions
- Logic Apps
- Automation-related actions
Example:
Alert
 ↓
Action Group
 ↓
Email IT Team
+
Send webhook
+
Trigger automation
Action Groups allow the notification mechanism to be reused by multiple alert rules.
114. Why should Action Groups be standardized?
Suppose an organization has:
500 alert rules
If every alert has individually configured recipients, changing an operations team’s contact information becomes difficult.
Instead:
Critical-Production
        ↓
Action Group
        ↓
Production Team
Multiple alert rules can reference the same Action Group.
This simplifies administration and change management.
115. What are Alert Processing Rules?
Alert Processing Rules allow organizations to modify how alerts are processed after they are generated.
They can be used for scenarios such as:
- Adding action groups
- Suppressing notifications
- Scheduled maintenance windows
- Resource-specific alert handling
For example:
01:00–03:00
Planned maintenance

↓
Suppress selected notifications
This can reduce unnecessary alert noise during planned activities.
116. What is alert fatigue?
Alert fatigue occurs when administrators receive too many alerts, including alerts that do not require action.
For example:
1000 alerts/day
↓
950 are ignored
↓
50 are investigated
This is dangerous because important alerts can be overlooked.
A good monitoring design should prioritize:
- Actionable alerts
- Correct thresholds
- Alert severity
- Deduplication
- Appropriate notification channels
- Maintenance suppression
- Clear ownership
117. How would you reduce excessive Azure Monitor alerts?
I would use this process:
1. Identify noisy alerts
Determine which alerts fire most frequently.
2. Review thresholds
Check whether thresholds reflect actual operational requirements.
3. Remove duplicate alerts
Avoid multiple alerts for the same condition.
4. Use dynamic thresholds where appropriate
This can help for variable workloads.
5. Use alert processing rules
Suppress notifications during approved maintenance windows.
6. Route alerts to the correct team
Not every alert should go to every administrator.
7. Review alerts periodically
Monitoring configuration should evolve with the environment.
118. What is Azure Service Health?
Azure Service Health provides information about Azure service-related events that may affect your resources.
Important categories include:
- Service issues
- Planned maintenance
- Health advisories
It can help determine whether an incident is related to an Azure platform event rather than an organization’s own configuration.
119. What is the difference between Service Health, Resource Health and Activity Log?
This is a common senior-level interview question.
Service Health
Answers:
Is there an Azure platform event that may affect my services?
Resource Health
Answers:
What is the health state of this particular Azure resource?
Activity Log
Answers:
What Azure control-plane operations occurred?
Therefore:
Service Health
→ Azure platform/service events

Resource Health
→ Individual resource health

Activity Log
→ Management/control-plane activity
120. What is Azure Monitor Workbooks?
Azure Monitor Workbooks provide interactive reporting and visualization.
They can combine:
- Metrics
- Logs
- KQL queries
- Parameters
- Charts
- Tables
- Text
- Other Azure monitoring information
For example:
Production Monitoring Workbook

VM Health
Application Errors
Request Latency
Failed Operations
Security Events
Resource Health
A workbook can therefore provide an operational view without requiring administrators to run individual queries repeatedly.
121. What is the difference between Azure dashboards and Workbooks?
Dashboards
Primarily provide a customizable collection of tiles.
Workbooks
Provide richer interactive reporting capabilities, including:
- Queries
- Parameters
- Filters
- Multiple visualizations
- Narrative text
- Interactive analysis
A senior administrator might use:
Dashboard
→ High-level operational status

Workbook
→ Detailed investigation and analysis
122. What is Azure Advisor?
Azure Advisor analyzes Azure resource configuration and usage and provides recommendations.
Advisor recommendations can cover areas such as:
- Reliability
- Security
- Performance
- Cost
- Operational Excellence
Examples may include recommendations related to:
- Underutilized resources
- Security configuration
- Resiliency
- Performance optimization
- Cost optimization
Advisor should be treated as a recommendation engine, not as an automatic authority. Administrators should validate recommendations against application requirements before implementing them.
123. How can Azure Advisor help with cost optimization?
Advisor can identify opportunities such as underutilized or oversized resources.
For example:
VM allocated:
8 vCPU

Observed workload:
Low utilization
Advisor may recommend reviewing the resource configuration.
Before changing it, verify:
- Business requirements
- Peak utilization
- Performance requirements
- Availability requirements
- Licensing implications
- Application dependencies
124. What is Azure Cost Management?
Azure Cost Management provides tools to analyze and control Azure spending.
Important capabilities include:
- Cost Analysis
- Budgets
- Cost alerts
- Cost allocation
- Forecasting
- Cost optimization analysis
A senior administrator should understand that monitoring is not limited to availability and performance.
Cost is also an operational signal.
125. How would you investigate an unexpected increase in Azure cost?
I would follow this process:
Cost increase detected
        ↓
Identify subscription
        ↓
Identify resource group
        ↓
Identify resource/service
        ↓
Compare with previous period
        ↓
Identify usage increase
        ↓
Check configuration changes
        ↓
Check deployments
        ↓
Check data transfer / ingestion
        ↓
Take corrective action
For monitoring specifically, excessive Log Analytics ingestion can itself become a significant cost factor.
126. How can monitoring itself become expensive?
Monitoring can generate significant costs when an organization collects unnecessary amounts of telemetry.
Potential causes include:
- Excessive log ingestion
- Verbose application logging
- Unnecessary diagnostic categories
- Long retention periods
- High-volume telemetry
- Repeated data collection
- Poorly designed monitoring
A good monitoring architecture balances:
Observability
+
Security
+
Troubleshooting
+
Cost
The goal is not to collect everything indiscriminately.
127. How would you design monitoring for 500 Azure VMs?
I would avoid configuring every VM independently.
A scalable design could look like:
                Azure Monitor
                     |
        +------------+-------------+
        |                          |
     Metrics                    Logs
        |                          |
     Alerts                Log Analytics
                                   |
                                  KQL
                                   |
                              Workbooks
                                   |
                            Incident Response
For VM log collection:
VMs
 ↓
Azure Monitor Agent
 ↓
DCRs
 ↓
Log Analytics
Then I would implement:
- Standardized monitoring policies
- Appropriate DCRs
- Centralized workbooks
- Action Groups
- Alert severity standards
- Service Health alerts
- Resource Health monitoring
- Cost monitoring
- Azure Advisor review
128. A production application suddenly becomes slow. How would you investigate it using Azure Monitor?
I would not immediately restart resources.
I would establish:
Step 1 — Define the incident
Determine:
- Start time
- End time
- Affected users
- Affected application
- Business impact
Step 2 — Check application telemetry
Review:
- Request duration
- Request failures
- Exceptions
- Dependencies
Step 3 — Check recent changes
Look for:
- Application deployment
- Configuration change
- Infrastructure change
- Identity change
Step 4 — Correlate telemetry
Use:
Requests
+
Dependencies
+
Exceptions
+
Activity Log
Step 5 — Determine the failing component
For example:
Requests slow
      ↓
Dependency latency increased
      ↓
Database response increased
The objective is to identify the actual cause rather than simply treating the symptom.
Do not immediately close the alert.
First determine:
- Which alert rule fired?
- Which metric or condition triggered it?
- What resource was evaluated?
- What was the evaluation period?
- Was the condition transient?
- Is the application actually affected?
- Is the alert threshold appropriate?
Then compare:
Alert telemetry
+
Resource health
+
Application telemetry
+
User impact
An alert is an indication requiring investigation; it is not automatically proof of business impact.
130. A critical alert did not fire during an incident. How would you troubleshoot the monitoring configuration?
I would check:
1. Alert rule
Was it enabled?
2. Scope
Was the affected resource included?
3. Condition
Did the telemetry actually meet the condition?
4. Evaluation period
Was the condition sustained long enough?
5. Data availability
Was telemetry being collected?
6. Diagnostic configuration
If the alert depended on logs, were the relevant logs reaching the workspace?
7. Action Group
Was the notification/action configuration correct?
8. Alert processing rules
Was notification suppressed?
This separates:
Alert condition problem
from:
Notification/action problem
131. What would you check if Azure Monitor Agent is installed but expected VM logs are missing?
I would check:
VM
 ↓
AMA installed/running?
 ↓
DCR associated?
 ↓
DCR collecting required data?
 ↓
Correct destination?
 ↓
Network/connectivity requirements?
 ↓
Expected table receiving data?
I would also check whether the requested data source is actually configured in the DCR.
The presence of the agent alone does not prove that the required telemetry is being collected.
132. Describe your approach to a major Azure production monitoring incident.
My approach would be:
Phase 1 — Establish impact
Identify:
- What is failing?
- Who is affected?
- When did it begin?
- Is it still occurring?
Phase 2 — Establish timeline
Correlate:
Application telemetry
        +
Azure metrics
        +
Activity Log
        +
Resource Health
        +
Service Health
        +
Recent changes
Phase 3 — Identify the failing layer
Determine whether the problem is primarily:
Application
Identity
Platform
Resource
Configuration
Dependency
Monitoring
Phase 4 — Contain
Apply the minimum safe action required to restore service.
Phase 5 — Validate
Confirm recovery through:
- Metrics
- Logs
- Application telemetry
- Health status
- User/business validation
Phase 6 — Prevent recurrence
After recovery:
- Tune alerts
- Improve dashboards/workbooks
- Improve logging
- Review DCRs
- Review Action Groups
- Document the incident
- Create corrective actions
Important Azure Monitor KQL Examples
Find recent failed Azure operations
AzureActivity
| where TimeGenerated > ago(24h)
| where ActivityStatusValue == "Failed"
| project TimeGenerated, Caller, OperationNameValue, ResourceGroup, ResourceId
| order by TimeGenerated desc
Count failed operations by caller
AzureActivity
| where TimeGenerated > ago(24h)
| where ActivityStatusValue == "Failed"
| summarize FailedOperations=count() by Caller
| order by FailedOperations desc
Find recent activity for a resource
AzureActivity
| where TimeGenerated > ago(24h)
| where ResourceId contains "my-vm"
| project TimeGenerated, Caller, OperationNameValue, ActivityStatusValue
| order by TimeGenerated desc
Check VM heartbeat
Heartbeat
| summarize LastHeartbeat=max(TimeGenerated) by Computer
| order by LastHeartbeat asc
This can help identify systems whose heartbeat telemetry is no longer arriving.
Investigate CPU telemetry
Where CPU data is available in InsightsMetrics:
InsightsMetrics
| where TimeGenerated > ago(1h)
| where Name == "Percentage CPU"
| summarize AverageCPU=avg(Val) by Computer, bin(TimeGenerated, 5m)
| order by TimeGenerated asc
Find application exceptions
AppExceptions
| where TimeGenerated > ago(1h)
| summarize ExceptionCount=count() by ExceptionType
| order by ExceptionCount desc
Find failed application requests
AppRequests
| where TimeGenerated > ago(1h)
| where Success == false
| summarize Failures=count() by Name
| order by Failures desc
Find slow application requests
AppRequests
| where TimeGenerated > ago(1h)
| where DurationMs > 2000
| project TimeGenerated, Name, DurationMs, ResultCode
| order by DurationMs desc
Useful Azure CLI Commands
List diagnostic settings
az monitor diagnostic-settings list \
  --resource <resource-id>
List available diagnostic categories
az monitor diagnostic-settings categories list \
  --resource <resource-id>
Query Azure Activity Log
az monitor activity-log list \
  --resource-group <resource-group>
Query metrics
az monitor metrics list \
  --resource <resource-id> \
  --metric "Percentage CPU"
List Action Groups
az monitor action-group list
List metric alerts
az monitor metrics alert list
List Activity Log alerts
az monitor activity-log alert list
List Log Analytics workspaces
az monitor log-analytics workspace list
List Advisor recommendations
az advisor recommendation list
Useful PowerShell Commands
Get Azure Activity Log
Get-AzActivityLog -StartTime (Get-Date).AddHours(-24)
Get Azure metrics
Get-AzMetric -ResourceId "<resource-id>"
List Log Analytics workspaces
Get-AzOperationalInsightsWorkspace
Get Advisor recommendations
Get-AzAdvisorRecommendation
List Action Groups
Get-AzActionGroup
Quick Revision
| Topic | Key Point |
|---|---|
| Azure Monitor | Azure observability platform |
| Metrics | Numerical time-series data |
| Logs | Detailed event/telemetry records |
| Activity Log | Azure control-plane activity |
| Resource Logs | Resource/service-specific telemetry |
| Log Analytics | Query and analyze logs |
| KQL | Query language for Azure Monitor Logs |
| DCR | Defines data collection and processing |
| DCRA | Associates a DCR with a resource |
| AMA | Current Azure Monitor agent |
| Diagnostic Settings | Routes supported resource telemetry |
| Application Insights | Application performance monitoring |
| AppRequests | Application request telemetry |
| AppDependencies | Dependency telemetry |
| AppExceptions | Application exception telemetry |
| Metric Alert | Alert based on metrics |
| Log Alert | Alert based on KQL results |
| Activity Log Alert | Alert based on Azure Activity Log |
| Action Group | Defines alert actions/notifications |
| Alert Processing Rule | Controls alert processing |
| Service Health | Azure platform/service events |
| Resource Health | Health of an individual resource |
| Workbooks | Interactive monitoring reports |
| Advisor | Azure recommendations |
| Cost Management | Analyze and control Azure spending |
Exam Answer Summary
Azure Monitor
Azure’s centralized observability platform for metrics, logs, traces, events and application telemetry.
Log Analytics
The Azure Monitor experience used to query and analyze logs stored in Log Analytics workspaces.
KQL
Kusto Query Language used to query Azure Monitor Logs.
DCR
A Data Collection Rule defines what telemetry is collected, how it is processed and where it is sent.
AMA
Azure Monitor Agent collects supported telemetry and works with DCR-based collection.
Diagnostic Settings
Used to configure supported Azure resources to send platform logs and metrics to destinations such as Log Analytics, Storage or Event Hubs.
Application Insights
Azure Monitor’s application performance monitoring capability.
Metric Alert
Triggers based on metric conditions.
Log Alert
Uses a log query and a condition to trigger an alert.
Action Group
Defines what actions or notifications occur when an alert is triggered.
Service Health
Provides information about Azure service/platform events that may affect your environment.
Resource Health
Shows the health state of a particular Azure resource.
Azure Advisor
Provides recommendations across areas such as reliability, security, performance, cost and operational excellence.
Senior Interview Tip
At senior level, do not answer Azure Monitor questions only by naming portal features.
Explain the observability flow:
Collect
   ↓
Store
   ↓
Query
   ↓
Correlate
   ↓
Alert
   ↓
Respond
   ↓
Improve
For example, if an interviewer asks:
“How would you monitor a production Azure environment?”
A strong answer is:
“I would use Azure Monitor as the central observability platform. I would collect the required resource and application telemetry using appropriate monitoring configurations, use Azure Monitor Agent and DCRs for supported VM data collection, send logs to Log Analytics, use KQL for investigation, Application Insights for application telemetry, metric and log-based alerts for actionable conditions, Action Groups for notifications and automation, Workbooks for operational visibility, and Service Health and Resource Health for Azure platform and resource-level events. I would also regularly review Azure Advisor and monitoring ingestion costs.”
That demonstrates architecture and operational thinking, rather than simply knowing Azure portal menus.
Microsoft Azure Interview Questions & Answers –Series Completed
The Azure section now covers five distinct areas:
Part 1: Azure Networking Fundamentals, VNets, Subnets, NSGs & Connectivity
Part 2: Azure Virtual Machines, Compute, Disks & Availability
Part 3: Azure Storage, Blob Storage, Azure Files, Redundancy & Troubleshooting
Part 4: Load Balancer, Application Gateway, Front Door & Traffic Manager
Part 5: Azure Monitor, Log Analytics, Application Insights, Alerts & Production Monitoring
The five parts together provide a senior-level Azure administration interview foundation without repeatedly asking the same networking, VM, storage or traffic-management questions.
Next Part
Microsoft Intune & Endpoint Management
The next interview series will move to:
- Microsoft Intune architecture
- Enrollment
- Windows Autopilot
- Configuration profiles
- Compliance policies
- Application deployment
- Windows Update management
- Device restrictions
- Endpoint security
- Defender integration
- Conditional Access integration
- Device troubleshooting
- Hybrid/Azure AD joined device scenarios
- Real-world enterprise endpoint incidents
- PowerShell and Intune troubleshooting
The next parts will continue using the same rule: one meaningful question per concept or scenario, with repeated questions avoided.
For official Microsoft 365 documentation and additional technical information, visit: Microsoft Learn